3.4 KiB
Download the model and place it in the models directory
Extract Mel Spectrogram with TacotronSTFT
Why does Tacotron need to generate Mel Spectrogram before generating speech? It is generally believed that the frequency domain signal (spectrogram) of speech has stronger consistency than the time domain signal (waveform amplitude) (consistent pronunciation spectrogram has consistent performance but waveform differences are large). After processing with windowing and other methods, the spectrogram of adjacent frames has coherence, which has better predictability than waveform data. In addition, the spectrogram is generally processed at the frame level, while the waveform is processed at the sample points, with a much larger number of samples and naturally greater computational complexity. Therefore, the spectrogram is usually predicted first, and then the waveform is reconstructed through a vocoder to transform the Mel spectrogram feature expression into a time-domain waveform sample.
Fourier Transform
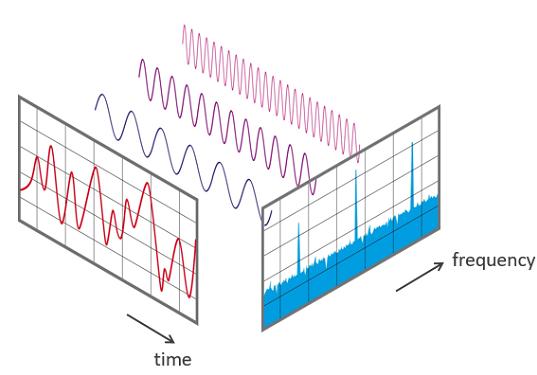
An audio signal is composed of several single-frequency sound waves. When we sample the signal over a period of time, we only capture the amplitude. Since each signal can be decomposed into a set of sine and cosine waves that add up to the original signal, this is the famous Fourier theorem. The Fourier transform is a mathematical formula that allows us to decompose a signal into individual frequencies and frequency amplitudes. In other words, it transforms the signal from the time domain to the frequency domain. The result is called the spectrum. The Fast Fourier Transform (FFT) is an algorithm that efficiently calculates the Fourier transform. It is widely used in signal processing.
Short-time Fourier Transform - Generate Spectrogram
The Fast Fourier Transform is a powerful tool that allows us to analyze the frequency components of a signal.
However, the frequency components of most audio signals change over time, and these signals are called non-periodic signals.
At this time, we need a method to represent the spectrum of these signals that change over time.
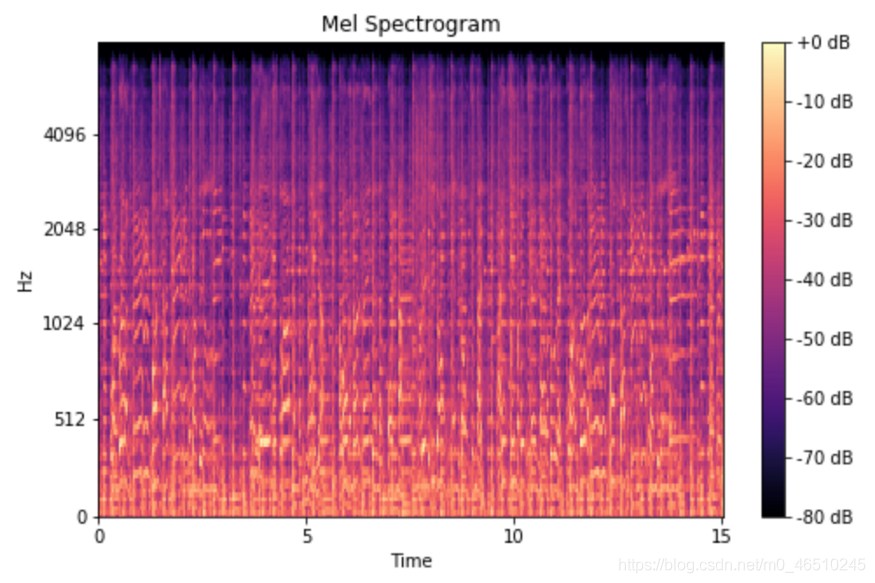
We solve this problem by calculating multiple spectra by performing FFT on multiple windowed parts of the signal, called Short-time Fourier Transform.
FFT is calculated on the overlapping windowed parts of the signal, and we get the so-called spectrogram.
-Short-Time Fourier Transform (STFT)

Run Example - TacotronSTFTExample
After successful execution, you should see the following information on the command line:
...
#Test speech file:
# src/test/resources/biaobei-009502.mp3

#Generate spectrogram matrix:
[INFO ] - melspec shape: [80, 379]

#Spectrogram matrix:
[INFO ] - Row 0: [-8.715169, -8.714043, -8.540381, ..., -8.508061, -8.397091]
[INFO ] - Row 1: [-8.985863, -8.835877, -8.99666, ..., -8.95394, -9.151459]
[INFO ] - Row 2: [-9.355588, -9.197474, -9.328396, ..., -10.741011, -10.295704]
...
[INFO ] - Row 77: [-11.512925, -11.512925, -11.512925, ..., -11.512925, -11.512925]
[INFO ] - Row 78: [-11.512925, -11.512925, -11.352638, ..., -11.512925, -11.512925]
[INFO ] - Row 79: [-11.512925, -11.512925, -11.512925, ..., -11.512925, -11.512925]

s
