### Benchmark Environments
n1-highcpu-8 (8 vCPUs, 7.2 GB memory) on Google Cloud
But we **only** used 4 cores to run APISIX, and left 4 cores for system and [wrk](https://github.com/wg/wrk),
which is the HTTP benchmarking tool.
### Benchmark Test for reverse proxy
Only used APISIX as the reverse proxy server, with no logging, limit rate, or other plugins enabled,
and the response size was 1KB.
#### QPS
The x-axis means the size of CPU core, and the y-axis is QPS.
 #### Latency
Note the y-axis latency in **microsecond(μs)** not millisecond.
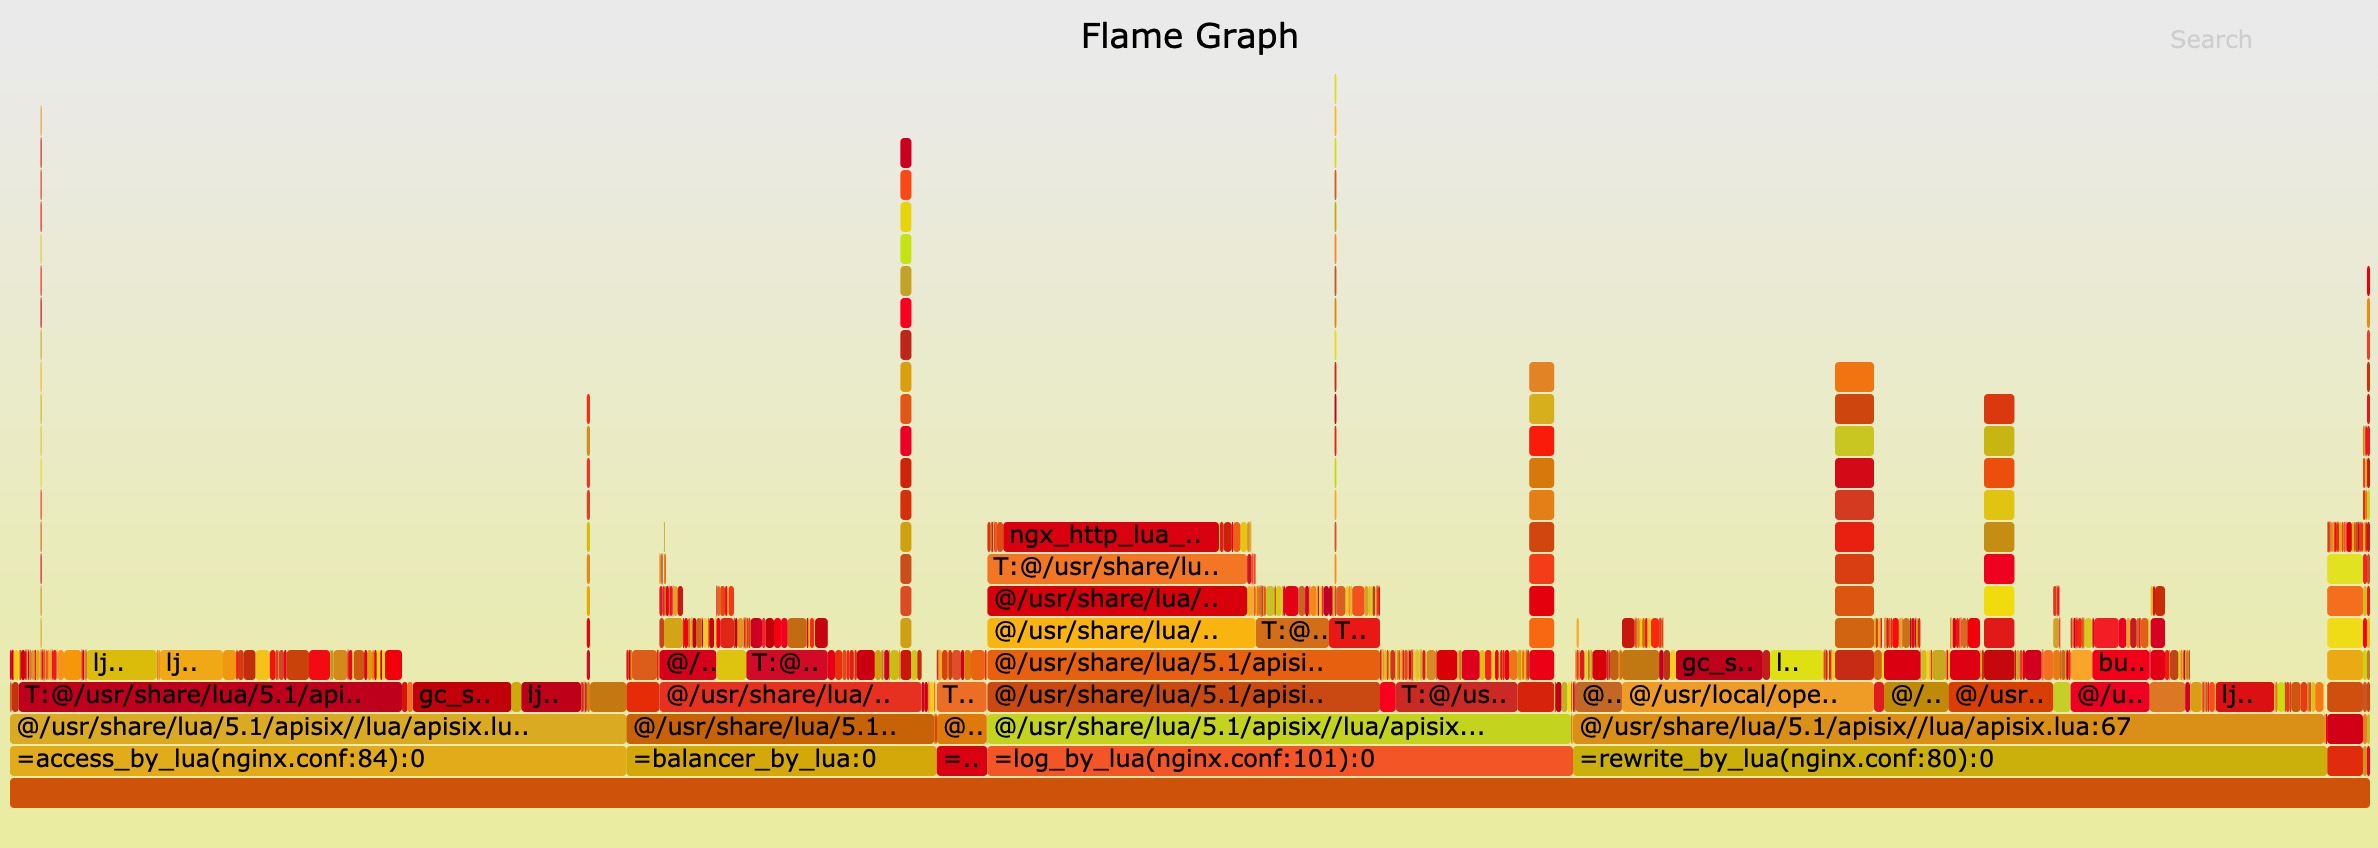
 #### Flame Graph
The result of Flame Graph:

And if you want to run the benchmark test in your machine, you should run another Nginx to listen 80 port.
```shell
curl http://127.0.0.1:9080/apisix/admin/routes/1 -X PUT -d '
{
"methods": ["GET"],
"uri": "/hello",
"upstream": {
"type": "roundrobin",
"nodes": {
"127.0.0.1:80": 1,
"127.0.0.2:80": 1
}
}
}'
```
then run wrk:
```shell
wrk -d 60 --latency http://127.0.0.1:9080/hello
```
### Benchmark Test for reverse proxy, enabled 2 plugins
Only used APISIX as the reverse proxy server, enabled the limit rate and prometheus plugins,
and the response size was 1KB.
#### QPS
The x-axis means the size of CPU core, and the y-axis is QPS.
#### Flame Graph
The result of Flame Graph:

And if you want to run the benchmark test in your machine, you should run another Nginx to listen 80 port.
```shell
curl http://127.0.0.1:9080/apisix/admin/routes/1 -X PUT -d '
{
"methods": ["GET"],
"uri": "/hello",
"upstream": {
"type": "roundrobin",
"nodes": {
"127.0.0.1:80": 1,
"127.0.0.2:80": 1
}
}
}'
```
then run wrk:
```shell
wrk -d 60 --latency http://127.0.0.1:9080/hello
```
### Benchmark Test for reverse proxy, enabled 2 plugins
Only used APISIX as the reverse proxy server, enabled the limit rate and prometheus plugins,
and the response size was 1KB.
#### QPS
The x-axis means the size of CPU core, and the y-axis is QPS.
 #### Latency
Note the y-axis latency in **microsecond(μs)** not millisecond.
 #### Flame Graph
The result of Flame Graph:

And if you want to run the benchmark test in your machine, you should run another Nginx to listen 80 port.
```shell
curl http://127.0.0.1:9080/apisix/admin/routes/1 -X PUT -d '
{
"methods": ["GET"],
"uri": "/hello",
"plugins": {
"limit-count": {
"count": 999999999,
"time_window": 60,
"rejected_code": 503,
"key": "remote_addr"
},
"prometheus":{}
},
"upstream": {
"type": "roundrobin",
"nodes": {
"127.0.0.1:80": 1,
"127.0.0.2:80": 1
}
}
}'
```
then run wrk:
```shell
wrk -d 60 --latency http://127.0.0.1:9080/hello
```
#### Flame Graph
The result of Flame Graph:

And if you want to run the benchmark test in your machine, you should run another Nginx to listen 80 port.
```shell
curl http://127.0.0.1:9080/apisix/admin/routes/1 -X PUT -d '
{
"methods": ["GET"],
"uri": "/hello",
"plugins": {
"limit-count": {
"count": 999999999,
"time_window": 60,
"rejected_code": 503,
"key": "remote_addr"
},
"prometheus":{}
},
"upstream": {
"type": "roundrobin",
"nodes": {
"127.0.0.1:80": 1,
"127.0.0.2:80": 1
}
}
}'
```
then run wrk:
```shell
wrk -d 60 --latency http://127.0.0.1:9080/hello
```
 #### Latency
Note the y-axis latency in **microsecond(μs)** not millisecond.
 #### Flame Graph
The result of Flame Graph:

And if you want to run the benchmark test in your machine, you should run another Nginx to listen 80 port.
```shell
curl http://127.0.0.1:9080/apisix/admin/routes/1 -X PUT -d '
{
"methods": ["GET"],
"uri": "/hello",
"upstream": {
"type": "roundrobin",
"nodes": {
"127.0.0.1:80": 1,
"127.0.0.2:80": 1
}
}
}'
```
then run wrk:
```shell
wrk -d 60 --latency http://127.0.0.1:9080/hello
```
### Benchmark Test for reverse proxy, enabled 2 plugins
Only used APISIX as the reverse proxy server, enabled the limit rate and prometheus plugins,
and the response size was 1KB.
#### QPS
The x-axis means the size of CPU core, and the y-axis is QPS.
#### Flame Graph
The result of Flame Graph:

And if you want to run the benchmark test in your machine, you should run another Nginx to listen 80 port.
```shell
curl http://127.0.0.1:9080/apisix/admin/routes/1 -X PUT -d '
{
"methods": ["GET"],
"uri": "/hello",
"upstream": {
"type": "roundrobin",
"nodes": {
"127.0.0.1:80": 1,
"127.0.0.2:80": 1
}
}
}'
```
then run wrk:
```shell
wrk -d 60 --latency http://127.0.0.1:9080/hello
```
### Benchmark Test for reverse proxy, enabled 2 plugins
Only used APISIX as the reverse proxy server, enabled the limit rate and prometheus plugins,
and the response size was 1KB.
#### QPS
The x-axis means the size of CPU core, and the y-axis is QPS.
 #### Latency
Note the y-axis latency in **microsecond(μs)** not millisecond.
 #### Flame Graph
The result of Flame Graph:

And if you want to run the benchmark test in your machine, you should run another Nginx to listen 80 port.
```shell
curl http://127.0.0.1:9080/apisix/admin/routes/1 -X PUT -d '
{
"methods": ["GET"],
"uri": "/hello",
"plugins": {
"limit-count": {
"count": 999999999,
"time_window": 60,
"rejected_code": 503,
"key": "remote_addr"
},
"prometheus":{}
},
"upstream": {
"type": "roundrobin",
"nodes": {
"127.0.0.1:80": 1,
"127.0.0.2:80": 1
}
}
}'
```
then run wrk:
```shell
wrk -d 60 --latency http://127.0.0.1:9080/hello
```
#### Flame Graph
The result of Flame Graph:

And if you want to run the benchmark test in your machine, you should run another Nginx to listen 80 port.
```shell
curl http://127.0.0.1:9080/apisix/admin/routes/1 -X PUT -d '
{
"methods": ["GET"],
"uri": "/hello",
"plugins": {
"limit-count": {
"count": 999999999,
"time_window": 60,
"rejected_code": 503,
"key": "remote_addr"
},
"prometheus":{}
},
"upstream": {
"type": "roundrobin",
"nodes": {
"127.0.0.1:80": 1,
"127.0.0.2:80": 1
}
}
}'
```
then run wrk:
```shell
wrk -d 60 --latency http://127.0.0.1:9080/hello
```