5.7 KiB
APISIX is a cloud-native microservices API gateway, delivering the ultimate performance, security, open source and scalable platform for all your APIs and microservices.
Summary
Install
Dependencies
- OpenResty
sudo yum install yum-utils
sudo yum-config-manager --add-repo https://openresty.org/package/centos/openresty.repo
sudo yum install openresty
- etcd
sudo yum install etcd
Install from RPM
wget http://39.97.63.215/download/apisix-0.1-2.noarch.rpm
sudo rpm -ivh apisix-0.1-2.noarch.rpm
If no error has occurred, APISIX is already installed in this directory: /usr/share/lua/5.1/apisix.
Now, you can try APISIX, go to Quickstart.
Install from Source
Now OpenResty and etcd are installed, we can use Luarocks to install APISIX’s Lua sources:
Install by Luarocks
luarocks install apisix
If you want to know more details, the Luarocks will clone and compile the following dependencies:
- [lua-resty-r3] Setups the resty-r3#install library.
- [lua-resty-etcd] Setups the resty-etcd#install library.
- [lua-resty-balancer] Setups the resty-balancer#install library.
- [lua-var-nginx-module] Setups the lua-var-nginx-module#install library, this C module is optional, it will use
ngx.var.*if the C module is not found.
Quickstart
- start etcd:
systemctl start etcd
- init etcd:
curl http://127.0.0.1:2379/v2/keys/apisix/routes -X PUT -d dir=true

curl http://127.0.0.1:2379/v2/keys/apisix/upstreams -X PUT -d dir=true

curl http://127.0.0.1:2379/v2/keys/apisix/services -X PUT -d dir=true
- start APISIX:
sudo openresty -p /usr/share/lua/5.1/apisix -c /usr/share/lua/5.1/apisix/conf/nginx.conf
- try limit count plugin
For the convenience of testing, we set up a maximum of 2 visits in 60 seconds, and return 503 if the threshold is exceeded:
curl http://127.0.0.1:2379/v2/keys/apisix/routes/1 -X PUT -d value='
{
	"methods": ["GET"],
	"uri": "/hello",
	"id": 1,
	"plugin_config": {
		"limit-count": {
			"count": 2,
			"time_window": 60,
			"rejected_code": 503,
			"key": "remote_addr"
		}
	},
	"upstream": {
		"type": "roundrobin",
		"nodes": {
			"220.181.57.215:80": 1,
			"220.181.57.216:80": 1
		}
	}
}'
$ curl -i -H 'Host: baidu.com' http://127.0.0.1:9080/hello
HTTP/1.1 302 Found
Content-Type: text/html; charset=iso-8859-1
Content-Length: 222
Connection: keep-alive
X-RateLimit-Limit: 2
X-RateLimit-Remaining: 0
...
Distributions
- Docker: TODO
- LuaRocks: luarocks install apisix
- CentOS: RPM for CentOS 7
- RedHat: TODO
- Ubuntu: TODO
- Homebrew:TODO
- Nightly Builds: TODO
Benchmark
Benchmark Environments
n1-highcpu-8 (8 vCPUs, 7.2 GB memory) on Google Cloud
But we only used 4 cores to run APISIX, and left 4 cores for system and wrk, which is the HTTP benchmarking tool.
Benchmark Test for reverse proxy
Only used APISIX as the reverse proxy server, with no logging, limit rate, or other plugins enabled, and the response size was 1KB.
QPS
The x-axis means the size of CPU core, and the y-axis is QPS.

Latency
Note the y-axis latency in microsecond(μs) not millisecond.

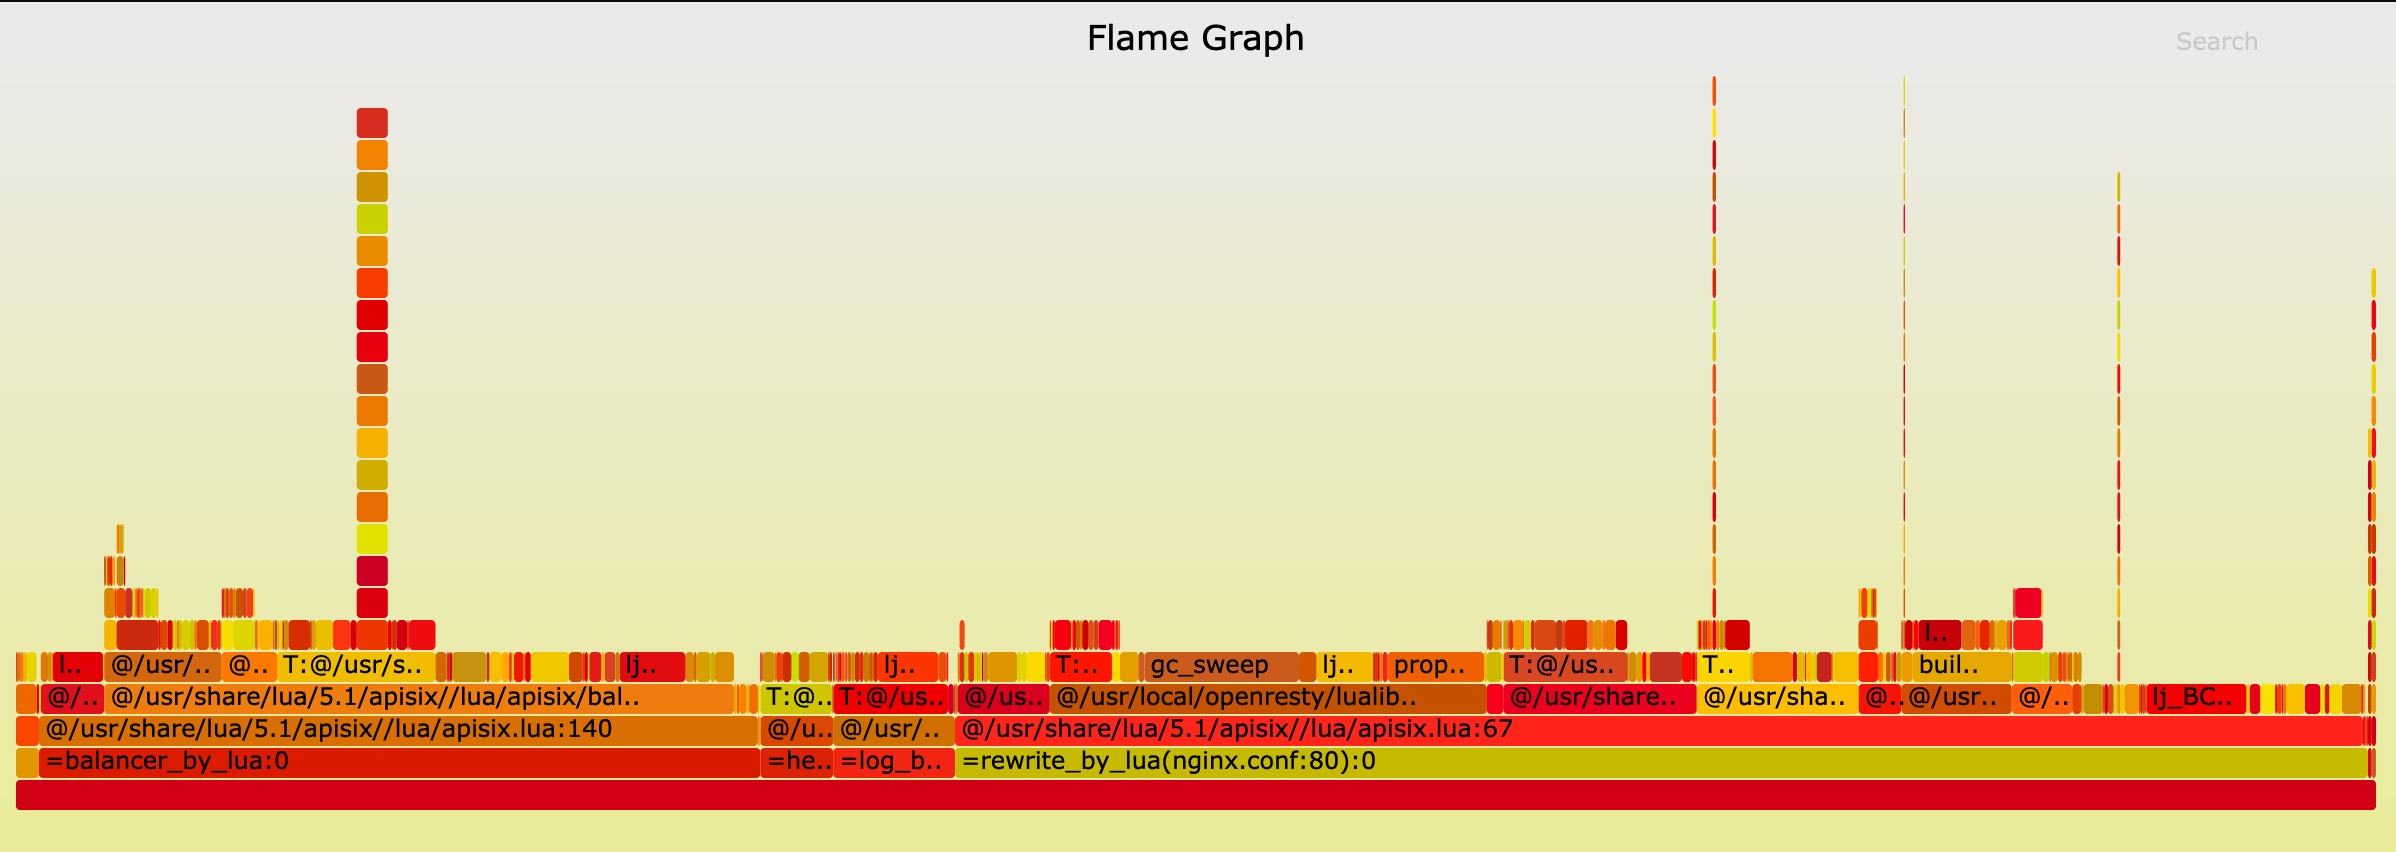
Flame Graph
And if you want to run the benchmark test in your machine, you should run another Nginx to listen 80 port.
curl http://127.0.0.1:2379/v2/keys/apisix/routes/1 -X PUT -d value='
{
    "methods": ["GET"],
    "uri": "/hello",
    "id": 1,
    "plugin_config": {},
    "upstream": {
        "type": "roundrobin",
        "nodes": {
            "127.0.0.1:80": 1,
            "127.0.0.2:80": 1
        }
    }
}'
then run wrk:
wrk -d 60 --latency http://127.0.0.1:9080/hello
Benchmark Test for reverse proxy, enabled 2 plugins
Only used APISIX as the reverse proxy server, enabled the limit rate and prometheus plugins, and the response size was 1KB.
QPS
The x-axis means the size of CPU core, and the y-axis is QPS.

Latency
Note the y-axis latency in microsecond(μs) not millisecond.

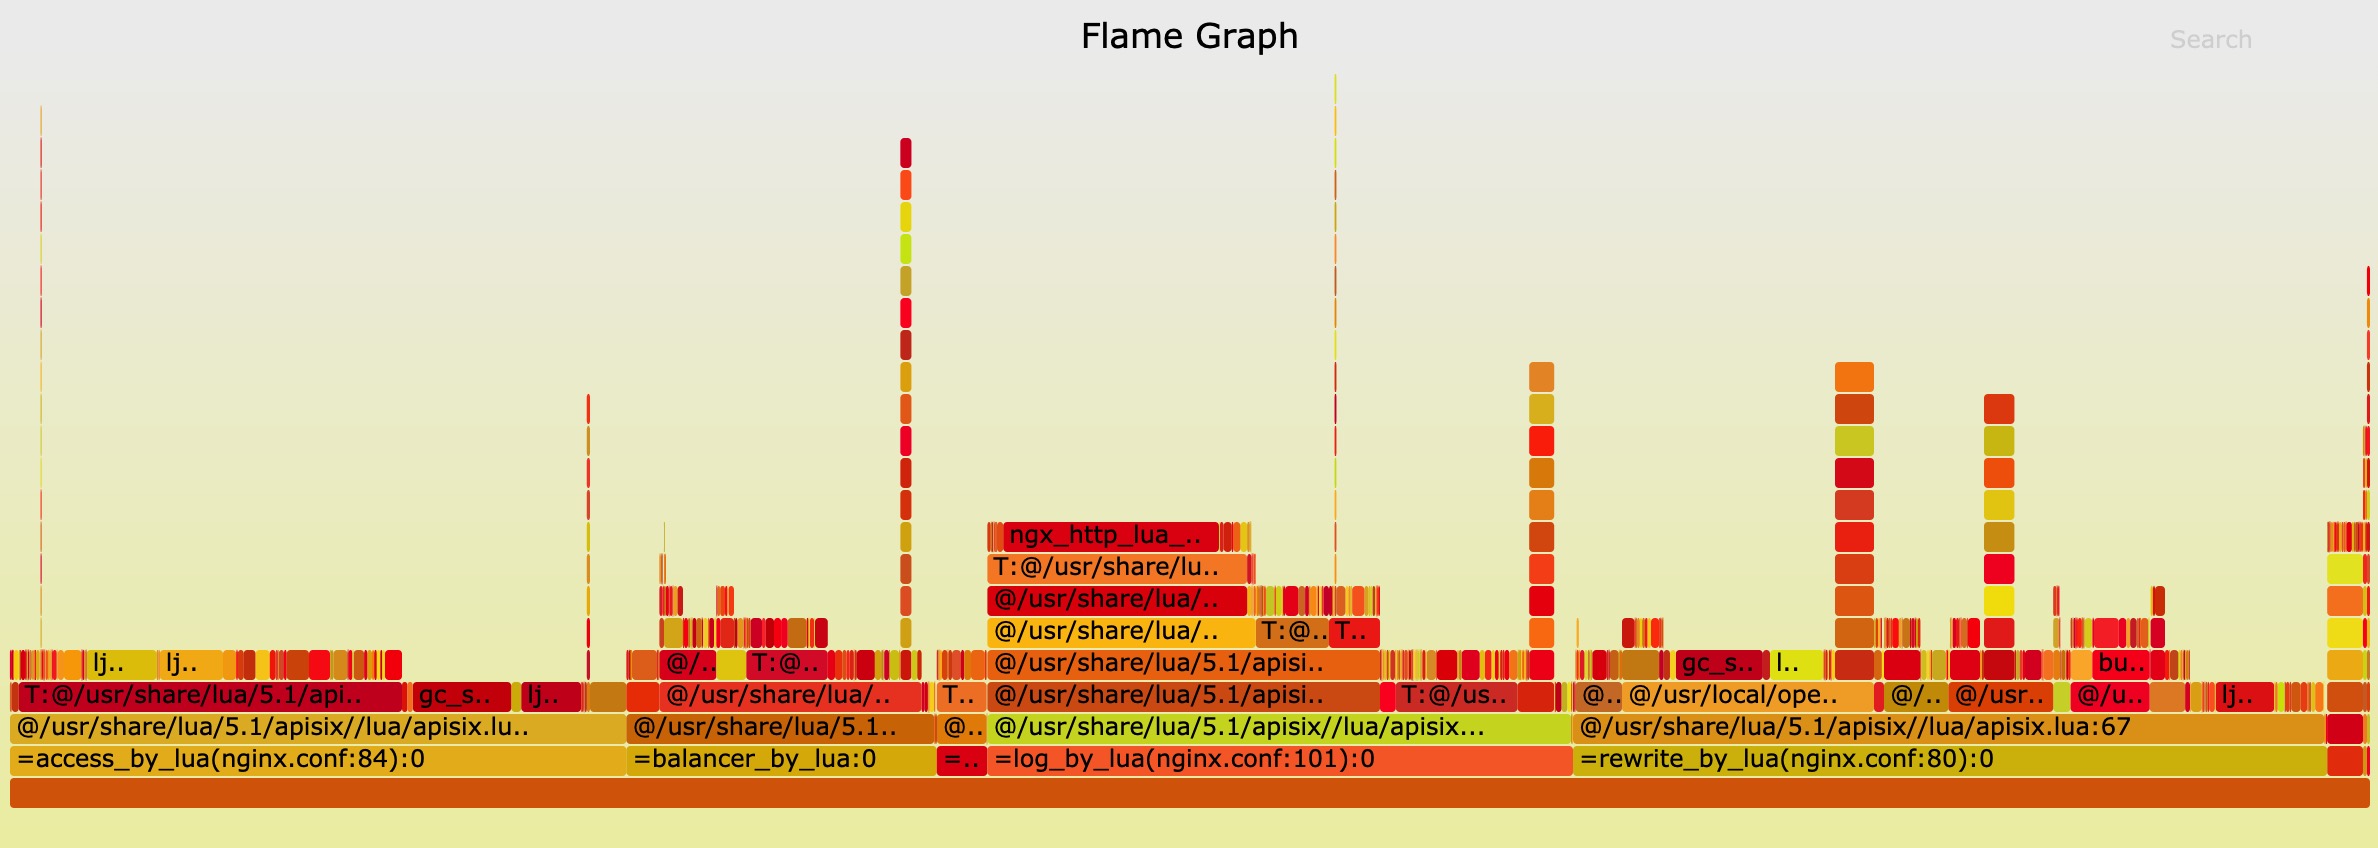
Flame Graph
And if you want to run the benchmark test in your machine, you should run another Nginx to listen 80 port.
curl http://127.0.0.1:2379/v2/keys/apisix/routes/1 -X PUT -d value='
{
    "methods": ["GET"],
    "uri": "/hello",
    "id": 1,
    "plugin_config": {
        "limit-count": {
            "count": 999999999,
            "time_window": 60,
            "rejected_code": 503,
            "key": "remote_addr"
        },
        "prometheus":{}
    },
    "upstream": {
        "type": "roundrobin",
        "nodes": {
            "127.0.0.1:80": 1,
            "127.0.0.2:80": 1
        }
    }
}'
then run wrk:
wrk -d 60 --latency http://127.0.0.1:9080/hello


