| bin | ||
| conf | ||
| doc | ||
| logs | ||
| lua | ||
| t | ||
| utils | ||
| .gitignore | ||
| .luacheckrc | ||
| .travis.yml | ||
| apisix-0.3-1.rockspec | ||
| CODE_OF_CONDUCT.md | ||
| COPYRIGHT | ||
| LICENSE | ||
| Makefile | ||
| README_CN.md | ||
| README.md | ||
APISIX is a cloud-native microservices API gateway, delivering the ultimate performance, security, open source and scalable platform for all your APIs and microservices.
Summary
Install
Dependencies
For different system depending on the different compilation tools, please see: Install Dependencies
Install apisix
sudo luarocks install apisix
If you see apisix *** is now built and installed, the apisix is already
installed to your machine.
Quickstart
- start server:
sudo apisix start
- try limit count plugin
For the convenience of testing, we set up a maximum of 2 visits in 60 seconds, and return 503 if the threshold is exceeded:
curl http://127.0.0.1:2379/v2/keys/apisix/routes/1 -X PUT -d value='
{
	"methods": ["GET"],
	"uri": "/index.html",
	"id": 1,
	"plugin_config": {
		"limit-count": {
			"count": 2,
			"time_window": 60,
			"rejected_code": 503,
			"key": "remote_addr"
		}
	},
	"upstream": {
		"type": "roundrobin",
		"nodes": {
			"39.97.63.215:80": 1
		}
	}
}'
$ curl -i http://127.0.0.1:9080/index.html
HTTP/1.1 200 OK
Content-Type: text/html
Content-Length: 13175
Connection: keep-alive
X-RateLimit-Limit: 2
X-RateLimit-Remaining: 1
Server: APISIX web server
Date: Mon, 03 Jun 2019 09:38:32 GMT
Last-Modified: Wed, 24 Apr 2019 00:14:17 GMT
ETag: "5cbfaa59-3377"
Accept-Ranges: bytes

...
Distributions
- Docker: TODO
- LuaRocks: luarocks install apisix
- CentOS: RPM for CentOS 7
- RedHat: TODO
- Ubuntu: TODO
- Homebrew:TODO
- Nightly Builds: TODO
Benchmark
Benchmark Environments
n1-highcpu-8 (8 vCPUs, 7.2 GB memory) on Google Cloud
But we only used 4 cores to run APISIX, and left 4 cores for system and wrk, which is the HTTP benchmarking tool.
Benchmark Test for reverse proxy
Only used APISIX as the reverse proxy server, with no logging, limit rate, or other plugins enabled, and the response size was 1KB.
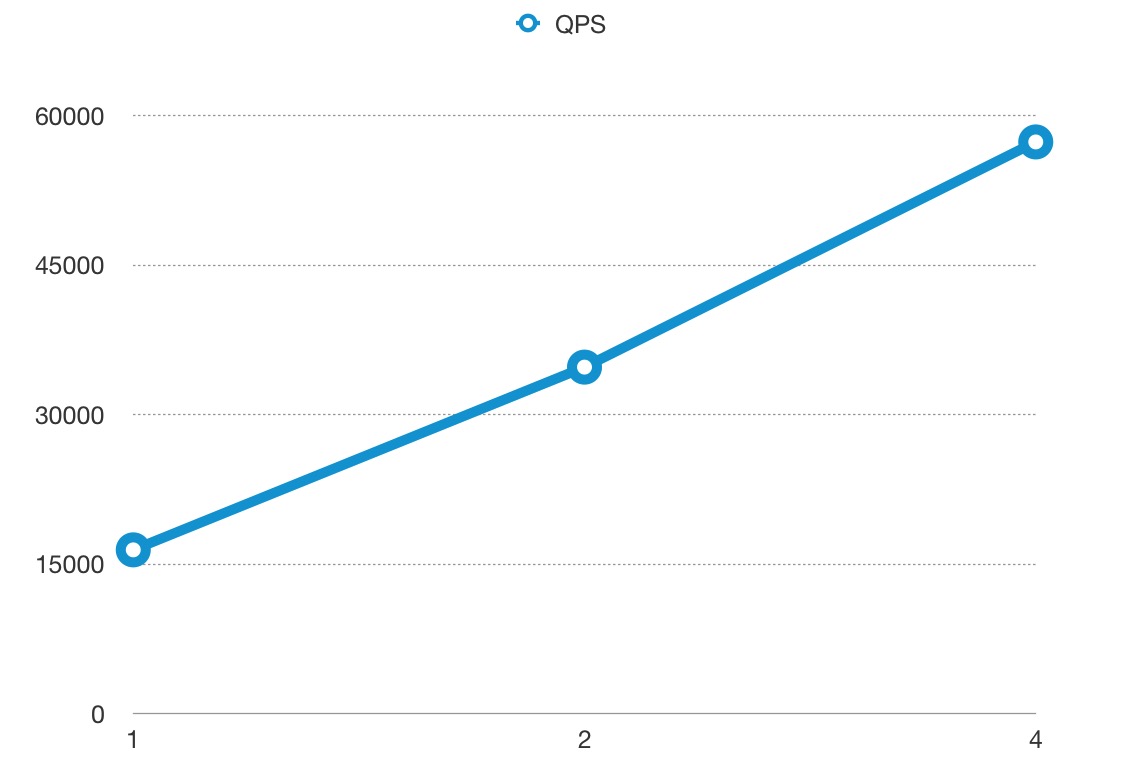
QPS
The x-axis means the size of CPU core, and the y-axis is QPS.

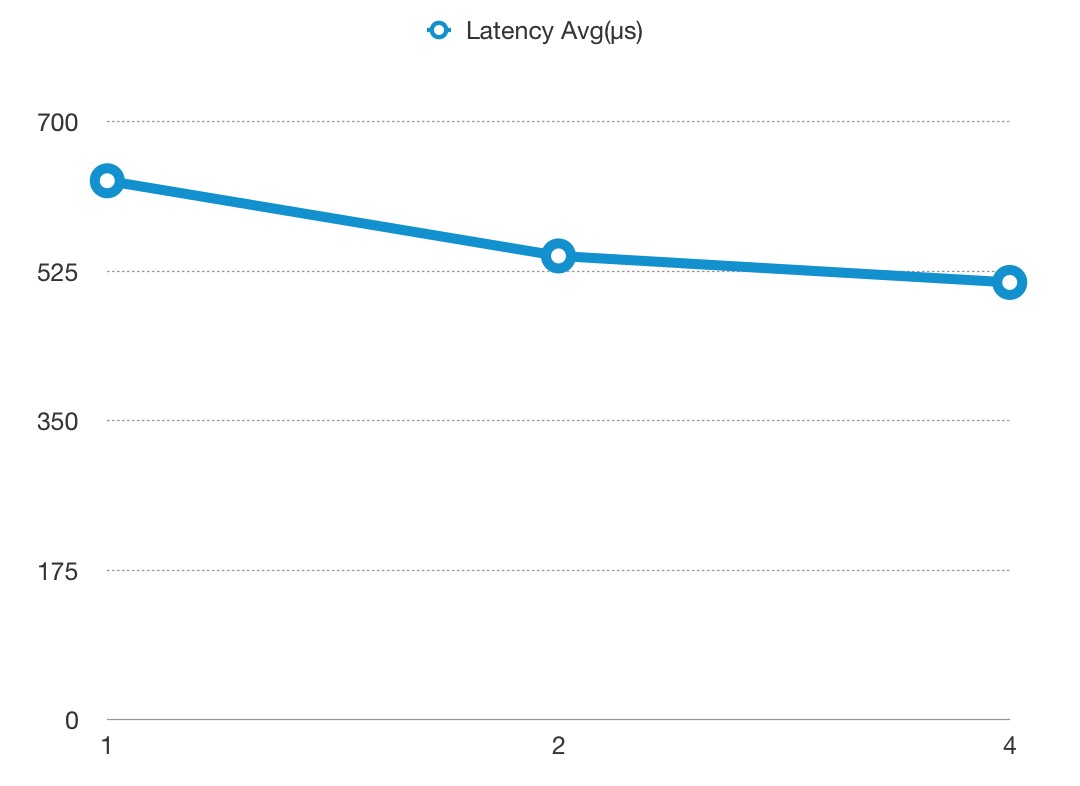
Latency
Note the y-axis latency in microsecond(μs) not millisecond.

Flame Graph
And if you want to run the benchmark test in your machine, you should run another Nginx to listen 80 port.
curl http://127.0.0.1:2379/v2/keys/apisix/routes/1 -X PUT -d value='
{
    "methods": ["GET"],
    "uri": "/hello",
    "id": 1,
    "plugin_config": {},
    "upstream": {
        "type": "roundrobin",
        "nodes": {
            "127.0.0.1:80": 1,
            "127.0.0.2:80": 1
        }
    }
}'
then run wrk:
wrk -d 60 --latency http://127.0.0.1:9080/hello
Benchmark Test for reverse proxy, enabled 2 plugins
Only used APISIX as the reverse proxy server, enabled the limit rate and prometheus plugins, and the response size was 1KB.
QPS
The x-axis means the size of CPU core, and the y-axis is QPS.

Latency
Note the y-axis latency in microsecond(μs) not millisecond.

Flame Graph
And if you want to run the benchmark test in your machine, you should run another Nginx to listen 80 port.
curl http://127.0.0.1:2379/v2/keys/apisix/routes/1 -X PUT -d value='
{
    "methods": ["GET"],
    "uri": "/hello",
    "id": 1,
    "plugin_config": {
        "limit-count": {
            "count": 999999999,
            "time_window": 60,
            "rejected_code": 503,
            "key": "remote_addr"
        },
        "prometheus":{}
    },
    "upstream": {
        "type": "roundrobin",
        "nodes": {
            "127.0.0.1:80": 1,
            "127.0.0.2:80": 1
        }
    }
}'
then run wrk:
wrk -d 60 --latency http://127.0.0.1:9080/hello
Development
How to load the plugin?
Plugin
inspired by Kong


