3.5 KiB
prometheus
This plugin exposes metrics in Prometheus Exposition format.
Attributes
none.
How to enable it
prometheus plugin can be enable with empty table, because it doesn't have
any options yet.
For example:
curl http://127.0.0.1:9080/apisix/admin/routes/1 -X PUT -d '
{
    "uri": "/hello",
    "plugins": {
        "prometheus":{}
    },
    "upstream": {
        "type": "roundrobin",
        "nodes": {
            "127.0.0.1:80": 1
        }
    }
}'
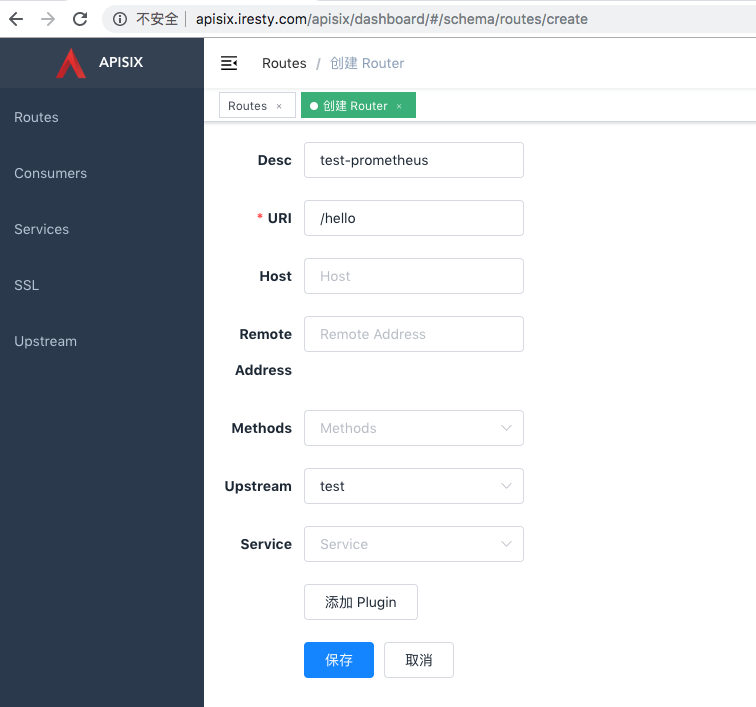
You can open dashboard with a browser: http://127.0.0.1:9080/apisix/dashboard/, to complete the above operation through the web interface, first add a route:
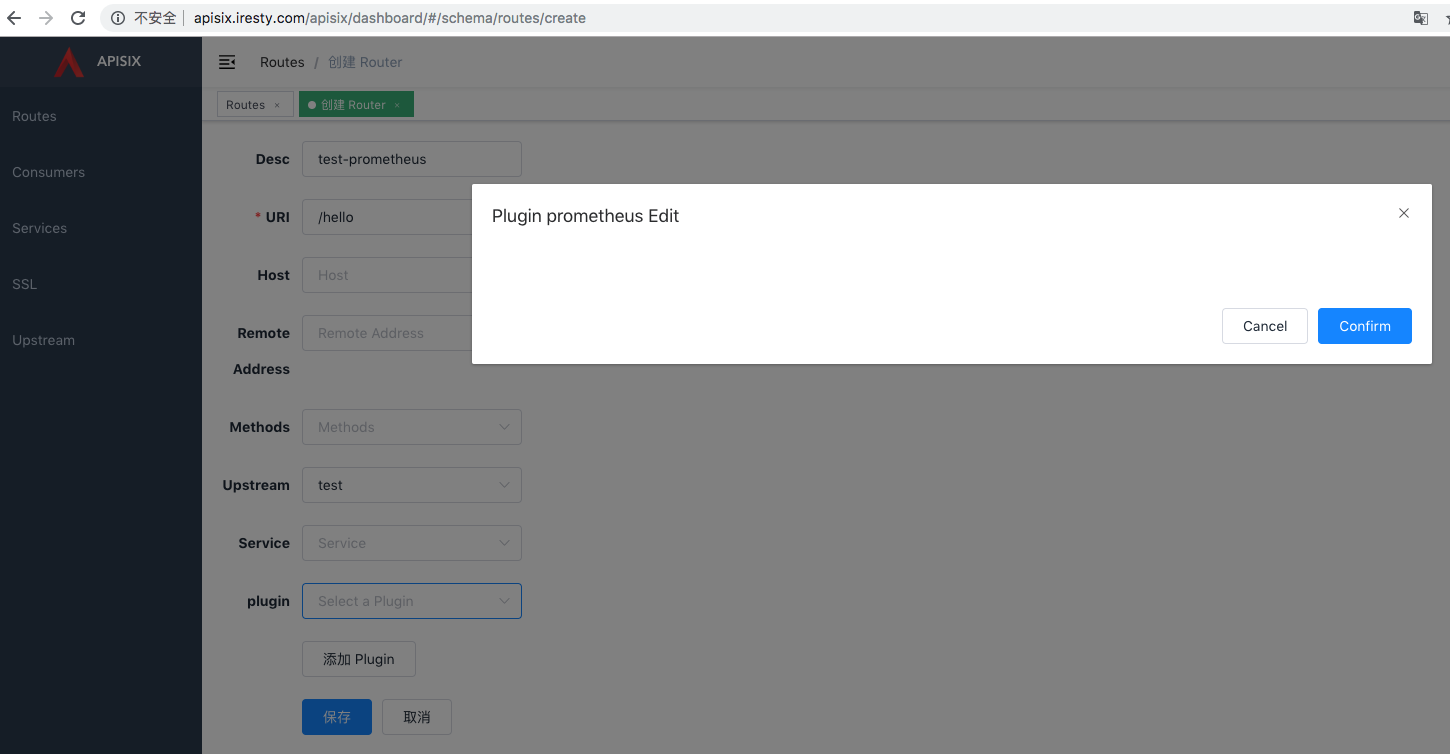
Then add prometheus plugin:
How to fetch the metric data
We fetch the metric data from the specified url /apisix/prometheus/metrics.
Puts this uri address into prometheus, and it will automatically fetch these metric data.
For example like this:
scrape_configs:
  - job_name: 'apisix'
    metrics_path: '/apisix/prometheus/metrics'
    static_configs:
    - targets: ['127.0.0.1:9080']
And we can check the status at prometheus console:
Grafana dashboard
Metrics exported by the plugin can be graphed in Grafana using a drop in dashboard: https://grafana.com/dashboards/7424 .
Available metrics
Status codes: HTTP status codes returned by upstream services. These are available per service and across all services.Bandwidth: Total Bandwidth (egress/ingress) flowing through apisix. This metric is available per service and as a sum across all services.etcd reachability: A gauge type with a value of 0 or 1, representing if etcd can be reached by a apisix or not.Connections: Various Nginx connection metrics like active, reading, writing, and number of accepted connections.
Here is the original metric data of apisix:
$ curl http://127.0.0.2:9080/apisix/prometheus/metrics
# HELP apisix_bandwidth Total bandwidth in bytes consumed per service in Apisix
# TYPE apisix_bandwidth counter
apisix_bandwidth{type="egress",service="127.0.0.2"} 183
apisix_bandwidth{type="egress",service="bar.com"} 183
apisix_bandwidth{type="egress",service="foo.com"} 2379
apisix_bandwidth{type="ingress",service="127.0.0.2"} 83
apisix_bandwidth{type="ingress",service="bar.com"} 76
apisix_bandwidth{type="ingress",service="foo.com"} 988
# HELP apisix_etcd_reachable Config server etcd reachable from Apisix, 0 is unreachable
# TYPE apisix_etcd_reachable gauge
apisix_etcd_reachable 1
# HELP apisix_http_status HTTP status codes per service in Apisix
# TYPE apisix_http_status counter
apisix_http_status{code="200",service="127.0.0.2"} 1
apisix_http_status{code="200",service="bar.com"} 1
apisix_http_status{code="200",service="foo.com"} 13
# HELP apisix_nginx_http_current_connections Number of HTTP connections
# TYPE apisix_nginx_http_current_connections gauge
apisix_nginx_http_current_connections{state="accepted"} 11994
apisix_nginx_http_current_connections{state="active"} 2
apisix_nginx_http_current_connections{state="handled"} 11994
apisix_nginx_http_current_connections{state="reading"} 0
apisix_nginx_http_current_connections{state="total"} 1191780
apisix_nginx_http_current_connections{state="waiting"} 1
apisix_nginx_http_current_connections{state="writing"} 1
# HELP apisix_nginx_metric_errors_total Number of nginx-lua-prometheus errors
# TYPE apisix_nginx_metric_errors_total counter
apisix_nginx_metric_errors_total 0


