3.3 KiB
| title |
|---|
| Benchmark |
Benchmark Environments
n1-highcpu-8 (8 vCPUs, 7.2 GB memory) on Google Cloud
But we only used 4 cores to run APISIX, and left 4 cores for system and wrk, which is the HTTP benchmarking tool.
Benchmark Test for reverse proxy
Only used APISIX as the reverse proxy server, with no logging, limit rate, or other plugins enabled, and the response size was 1KB.
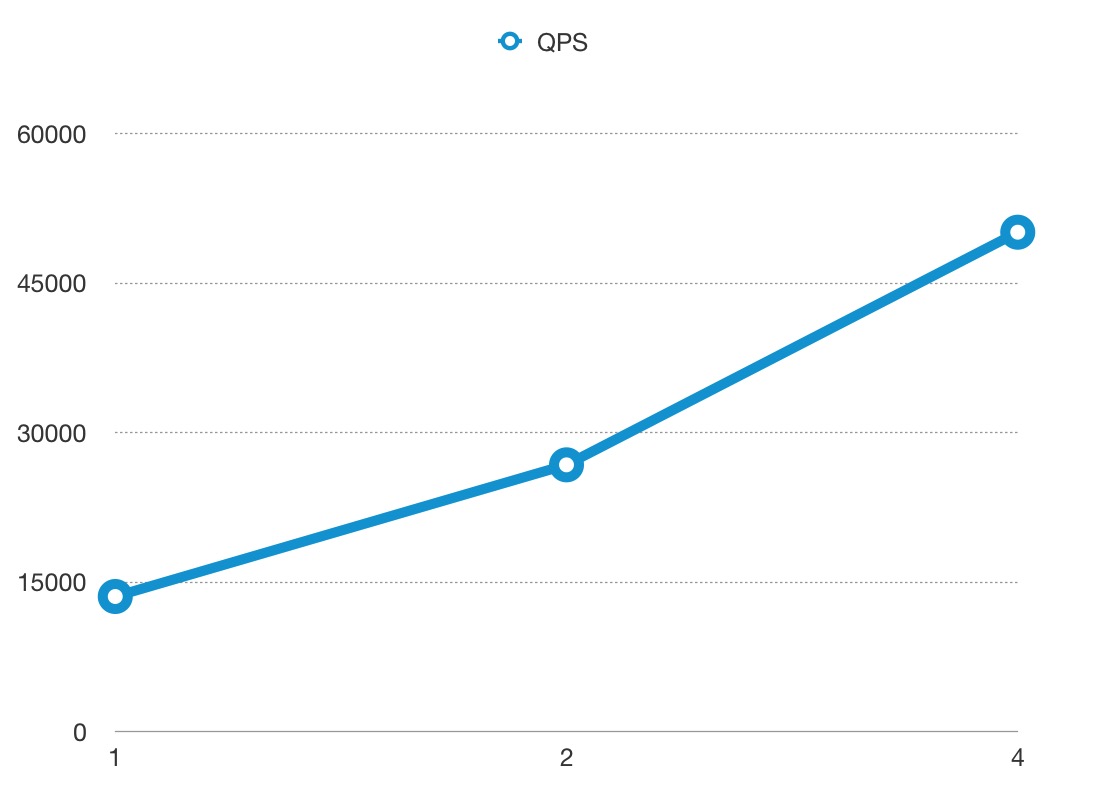
QPS
The x-axis means the size of CPU core, and the y-axis is QPS.

Latency
Note the y-axis latency in microsecond(μs) not millisecond.

Flame Graph
And if you want to run the benchmark test in your machine, you should run another Nginx to listen 80 port.
curl http://127.0.0.1:9080/apisix/admin/routes/1 -H 'X-API-KEY: edd1c9f034335f136f87ad84b625c8f1' -X PUT -d '
{
    "methods": ["GET"],
    "uri": "/hello",
    "upstream": {
        "type": "roundrobin",
        "nodes": {
            "127.0.0.1:80": 1,
            "127.0.0.2:80": 1
        }
    }
}'
then run wrk:
wrk -d 60 --latency http://127.0.0.1:9080/hello
Benchmark Test for reverse proxy, enabled 2 plugins
Only used APISIX as the reverse proxy server, enabled the limit rate and prometheus plugins, and the response size was 1KB.
QPS
The x-axis means the size of CPU core, and the y-axis is QPS.

Latency
Note the y-axis latency in microsecond(μs) not millisecond.

Flame Graph
And if you want to run the benchmark test in your machine, you should run another Nginx to listen 80 port.
curl http://127.0.0.1:9080/apisix/admin/routes/1 -H 'X-API-KEY: edd1c9f034335f136f87ad84b625c8f1' -X PUT -d '
{
    "methods": ["GET"],
    "uri": "/hello",
    "plugins": {
        "limit-count": {
            "count": 999999999,
            "time_window": 60,
            "rejected_code": 503,
            "key": "remote_addr"
        },
        "prometheus":{}
    },
    "upstream": {
        "type": "roundrobin",
        "nodes": {
            "127.0.0.1:80": 1,
            "127.0.0.2:80": 1
        }
    }
}'
then run wrk:
wrk -d 60 --latency http://127.0.0.1:9080/hello

