7.3 KiB
| title | order | redirect_from | |
|---|---|---|---|
| Introduction | 0 |
|
What is G6
G6 is a graph visualization engine, which provides a set of basic mechanisms, including rendering, layout, analysis, interaction, animation, and other auxiliary tools. G6 aims to simplify the relationships, and help people to obtain the insight of relational data.

Developers are able to build graph visualization analysis applications or graph visualization modeling applications easily.
Powerful Animation and Interactions


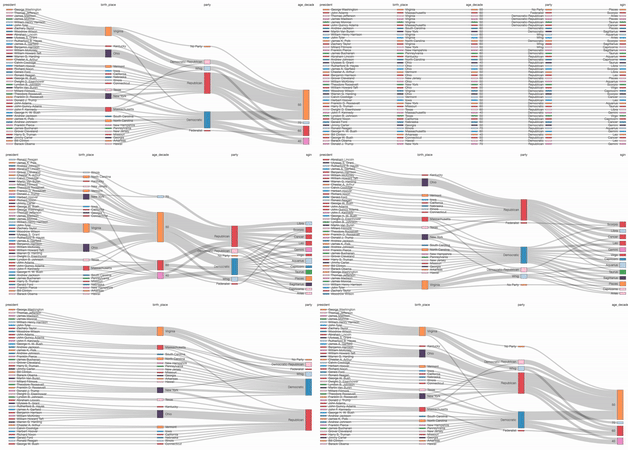
Powerful Layouts
🎉 Features (5.0 Alpha)
- Extensionable: All the modules (seven types) are integrated as plugins;
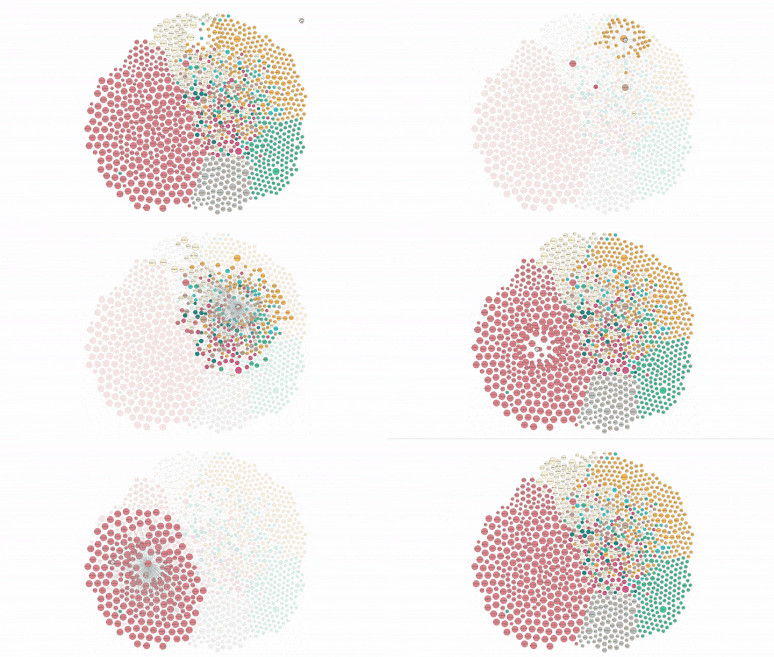
- Style and animation standards, supports level of details (see the graph below);
- Beautiful Built-in Theme and cound be customized (see the graph below);
- Layouts with Great Performance: More than 10 layout algorithms, supports GPU and Rust parallel computing, and custom layouts;
- Steerable Interactions: More than 10 basic interaction behaviors ;
- Friendly User Experience: Complete documents for different levels of user requirements. TypeScript supported.
- Multiple renderers: Canvas, SVG, WebGL;
- 3D Graph:
The gif is not fully loaded, Click Here to See the Original Image

3D Graph
The gif is not fully loaded, Click Here to See the Original Image

Animations and Level of Details

Built-in Themes and Custom Themes

Seven Types of Plugins
- Abundant Built-in Items: Nodes and edges with free configurations;
- Convenient Components: Outstanding ability and performance;
- Tree Shaking to reduce the package's size.
G6 concentrates on the principle of 'good by default'. In addition, the custom mechanism of the item, interation behavior, and layout satisfies the customazation requirements.
Abundant Built-in Items
Installation (5.0 Beta)
$ npm install @antv/g6@5.0.0-beta.20
Usage (5.0 Beta)

The configuration specification of the graph can be refered to: Specification Doc
Graph API: Graph API
A simple graph demo:

import G6 from '@antv/g6';

const data = {
  nodes: [
    {
      id: 'node1',
      data: {
        x: 150,
        y: 150,
        label: 'Node 1',
      },
    },
    {
      id: 'node2',
      data: {
        x: 400,
        y: 150,
        label: 'Node 2',
      },
    },
  ],
  edges: [
    {
      id: 'edge1',
      source: 'node1',
      target: 'node2',
      data: {
        label: 'Edge 1',
      },
    },
  ],
};

const graph = new G6.Graph({
  container: 'container',
  width: 500,
  height: 500,
  data,
  node: (innerModel) => ({
    ...innerModel,
    type: 'circle',
    data: {
      ...innerModel.data,
      labelShape: {
        text: innerModel.label,
      },
      labelBackgroundShape: {},
      iconShape: {
        img: 'https://gw.alipayobjects.com/zos/basement_prod/012bcf4f-423b-4922-8c24-32a89f8c41ce.svg',
      },
    },
  }),
  edge: (innerModel) => ({
    ...innerModel,
    type: 'line',
    data: {
      labelShape: {
        text: innerModel.label,
      },
      labelBackgroundShape: {},
    },
  }),
});
Development (5.0 Beta)
# enter packages/g6 from root of project
$ cd packages/g6

# install dependencies
$ npm install

# build
$ npm run build

# start the integration demos
$ npm run dev

# Test lint
$ npm run lint

# Fix lint
$ npm run fix

# Run all the integration tests
$ npm run test:integration

# Run one the integration test: modify the dir in test:integration_oneo be the one you want to test in package.json, then execute:
$ npm run test:integration_one
How to Contribute
Please let us know what you are you going to help. Do check out issues for bug reports or suggestions first.
Issue Hunt
Refer to the Doc of Issue Hunt.


