mirror of
https://gitee.com/antv/g6.git
synced 2024-11-30 18:58:34 +08:00
6.2 KiB
6.2 KiB
什么是 G6
G6 是一个图可视化引擎。它提供了图的绘制、布局、分析、交互、动画等图可视化的基础能力。旨在让关系变得透明,简单。让用户获得关系数据的 Insight。

基于 G6,用户可以快速搭建自己的 图分析 或 图编辑 应用。
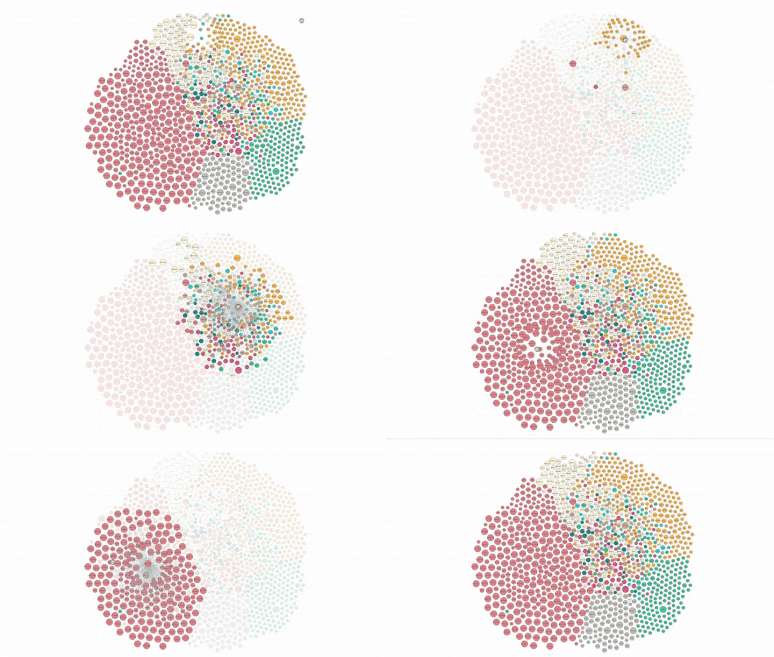
强大的动画及交互


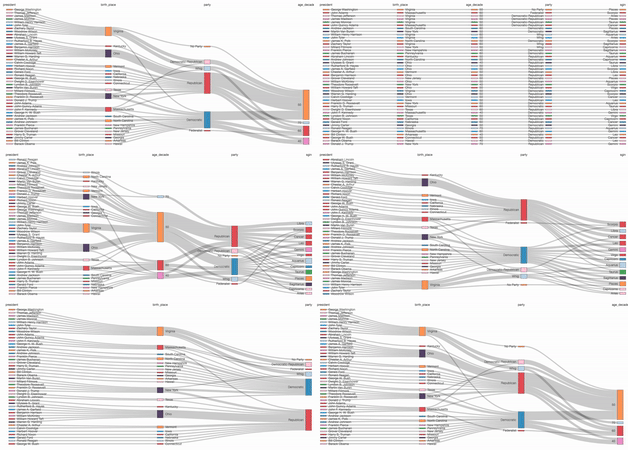
强大的布局
G6 的特性
G6 作为一款专业的图可视化引擎,具有以下特性:
- 丰富的元素:内置丰富的节点与边元素,自由配置,支持自定义;
- 可控的交互:内置 10+ 交互行为,支持自定义交互;
- 强大的布局:内置了 10+ 常用的图布局,支持自定义布局;
- 便捷的组件:优化内置组件功能及性能;
- 友好的体验:根据用户需求分层梳理文档,支持 TypeScript 类型推断。
除了默认好用、配置自由的内置功能,元素、交互、布局均具有高可扩展的自定义机制。

丰富的图元素
安装
$ npm install @antv/g6
使用

import G6 from '@antv/g6';

const data = {
  nodes: [
    {
      id: 'node1',
      label: 'Circle1',
      x: 150,
      y: 150,
    },
    {
      id: 'node2',
      label: 'Circle2',
      x: 400,
      y: 150,
    },
  ],
  edges: [
    {
      source: 'node1',
      target: 'node2',
    },
  ],
};

const graph = new G6.Graph({
  container: 'container',
  width: 500,
  height: 500,
  defaultNode: {
    shape: 'circle',
    size: [100],
    color: '#5B8FF9',
    style: {
      fill: '#9EC9FF',
      lineWidth: 3,
    },
    labelCfg: {
      style: {
        fill: '#fff',
        fontSize: 20,
      },
    },
  },
  defaultEdge: {
    style: {
      stroke: '#e2e2e2',
    },
  },
});

graph.data(data);
graph.render();
更多关于 G6 使用的问题,请参考快速上手。
开发
$ npm install

# run test case
$ npm test

# run test case in watch mode
npm test -- --watch ./tests/unit/algorithm/find-path-spec
DEBUG_MODE=1 npm test -- --watch ./tests/unit/algorithm/find-path-spec

# build watching file changes and run demos
$ npm run demos
文档
G6 图可视化交流群
欢迎各界 G6 使用者、图可视化爱好者加入 G6 图可视化交流群 及 G6 图可视化交流二群(钉钉群,使用钉钉扫一扫加入)讨论与交流。
G6 图可视化交流群 已满员,该群会不定期移除不活跃的成员。
由于值班同学的时间和精力有限,G6 图可视化交流二群 中的问题我们会不定期回复。欢迎对 G6 感兴趣的同学加入到答疑中来,非常感谢!交流群-1 已满,请加交流群-2。


如何贡献
请让我们知道您要解决或贡献什么,所以在贡献之前请先提交 issues 描述 bug 或建议。
成为一个贡献者前请阅读 代码贡献规范.


